As we can remember from Part 1, in binary classification the data points can be divided into four groups according to the real labels and the predictions given by the model. Let us denote - as is customary - by 0 the negative class, and by 1 the positive class.

In the above table, TN = True Negative, FP = False Positive, FN = False Negative, TP = True Positive. A model can make two types of errors: classifying a data point of negative class to be positive (FP) or of positive class to be negative (FN).

In binary classification we can predict each data point to have either value 0 or value 1 (“hard classification”). However, we will get more flexibility to the classification if, instead of two values, we predict probabilities for data points (“soft classification”). In this case, each data point will be given a value from the interval (0,1). The benefit of this is that we can define ourselves the threshold which will determine the data point’s class. A natural threshold is of course 0.5, which means that the data points with probability less than 0.5 will be classified as negative (class 0) and the data points with probability exceeding the threshold will be classified as positive (class 1).
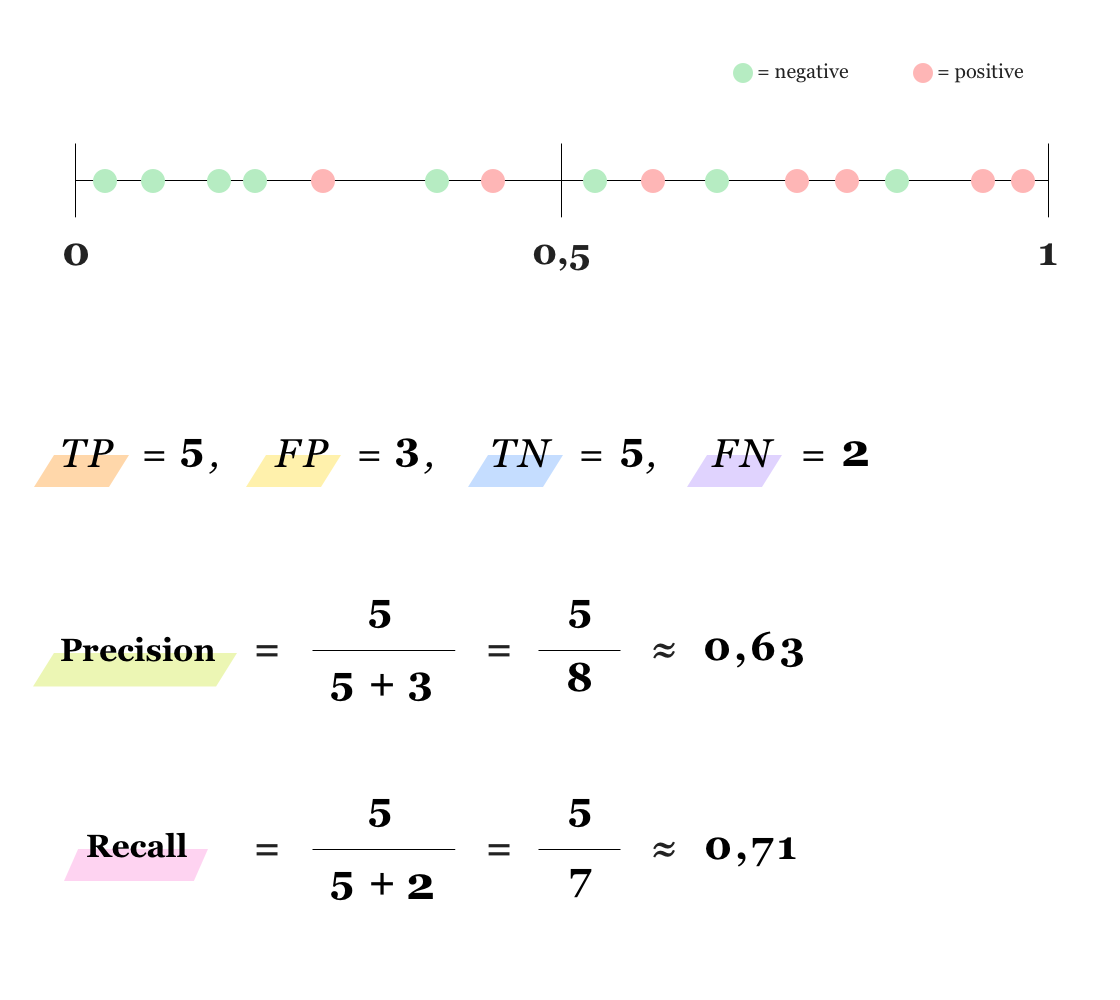
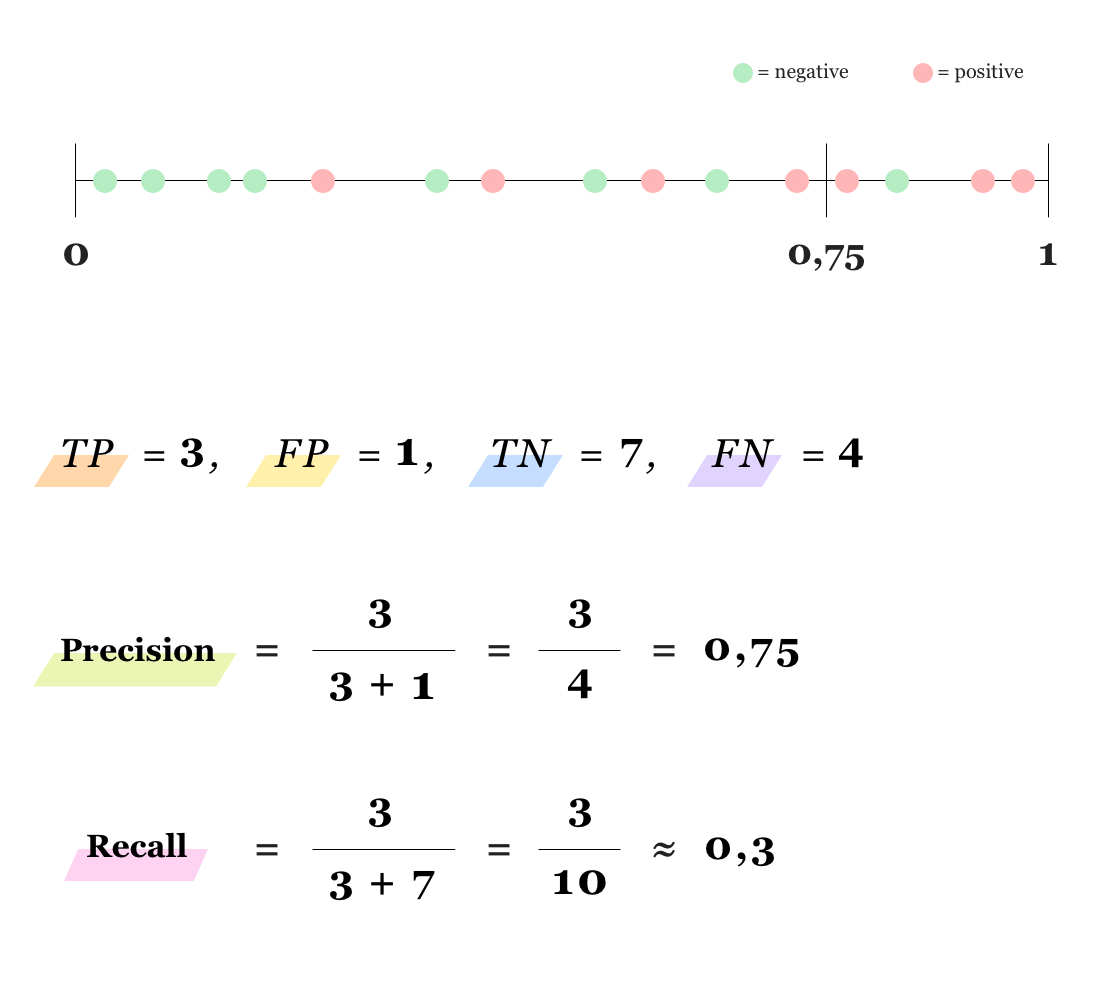
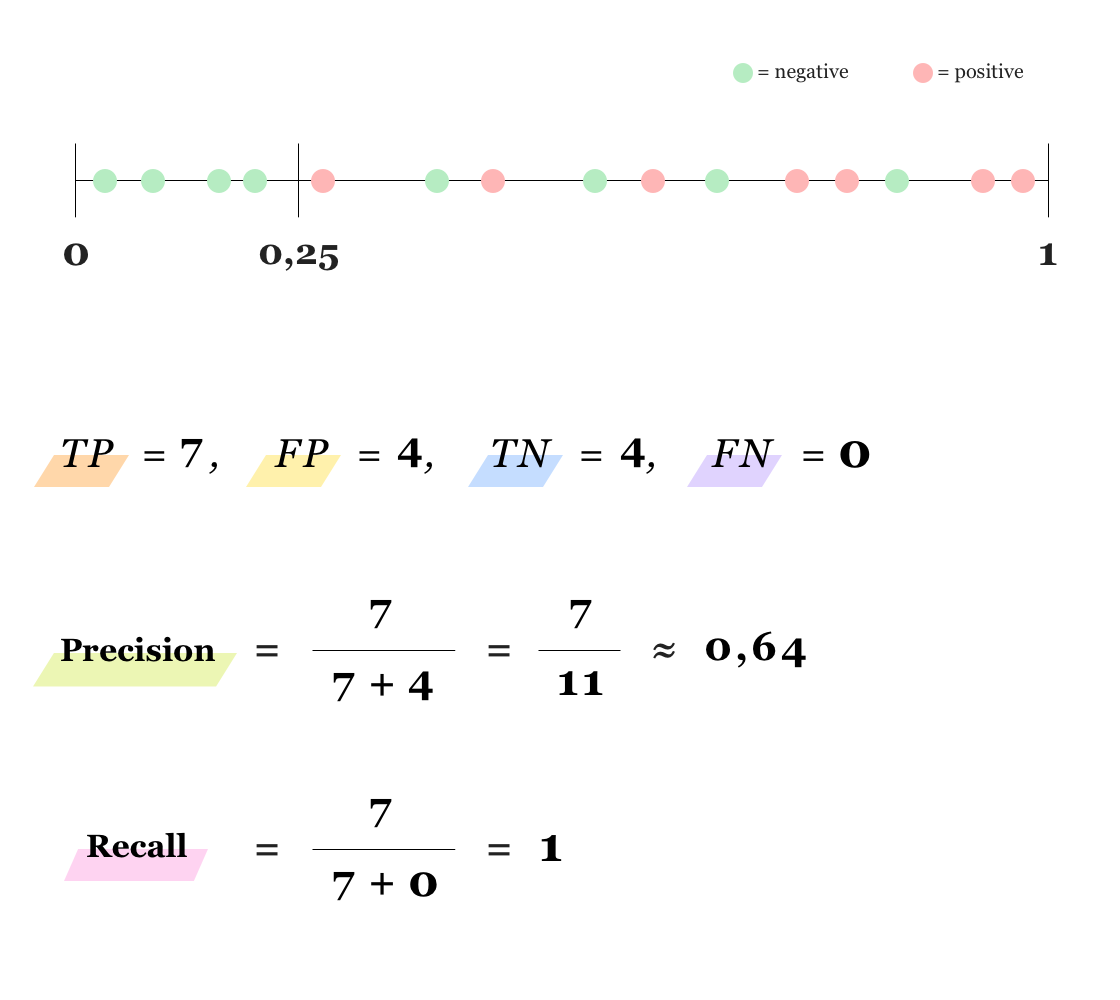
Depending on the consequences of the errors (FP and FN), it might be beneficial to shift the threshold in either direction. If you want to reduce the amount of false positives and hence increase precision, you must raise the threshold. This means that a data point needs to have a higher probability in order to be classified as positive. Similarly, the number of false negatives will be smaller and the model’s recall higher if you lower the threshold. The pictures below should illustrate the situation.
As you might already notice from the example pictures, it can be impossible to raise the precision and recall simultaneously. It is crucial to find a balance in which both metrics are good enough. F1 score is a good metric for this, but it only tells about the model for certain fixed threshold. The model can, nonetheless, be evaluated over different thresholds, namely we can draw a parametrized Precision-Recall Curve.
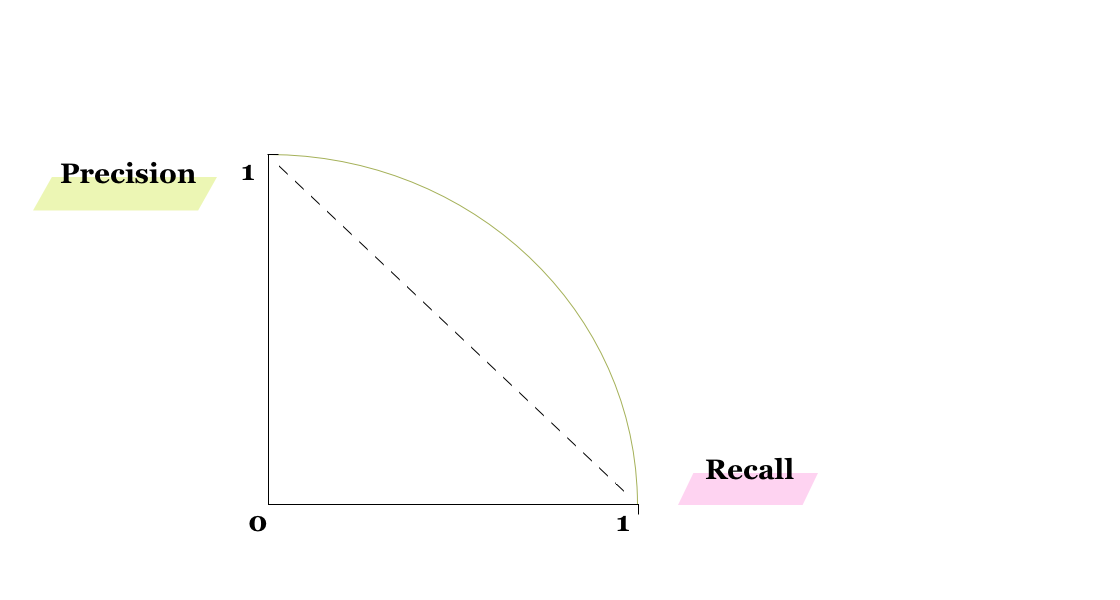
If the threshold is set to be 1.0, i.e. the model classifies all data points to be negative, then precision is 1 and recall is 0. Conversely, if the threshold is 0.0, which means that all data points are classified as positive, then the model’s precision is 0 and recall 1. Each point on the curve represents a precision-recall pair for certain threshold between 0 and 1. We can evaluate the model by the area under the precision-recall curve; the better the model, the higher the curve and the closer the area to 1.
As we have seen, basing your opinion on the model’s performance upon suitable metrics is central. Also, whenever you are applying machine learning, it’s good to keep in mind that the model should only be a by-product of understanding the phenomenon itself.
